Campaign URL
Copy
Twitter
0
tweets
Subscribe
Past Issues
RSS
Translate
English
العربية
Afrikaans
беларуская мова
български
català
中文(简体)
中文(繁體)
Hrvatski
Česky
Dansk
eesti keel
Nederlands
Suomi
Français
Deutsch
Ελληνική
हिन्दी
Magyar
Gaeilge
Indonesia
íslenska
Italiano
日本語
ភាសាខ្មែរ
한국어
македонски јазик
بهاس ملايو
Malti
Norsk
Polski
Português
Português - Portugal
Română
Русский
Español
Kiswahili
Svenska
עברית
Lietuvių
latviešu
slovenčina
slovenščina
српски
தமிழ்
ภาษาไทย
Türkçe
Filipino
украї́нська
Tiếng Việt
Miller Samuel's Market Charts
Forward
+1
Share
Tweet
Share
These are located in out
chart gallery
and most of them are created or updated during the research process for our expanding market report series found here:
millersamuel.com/reports
.
Market Charts:
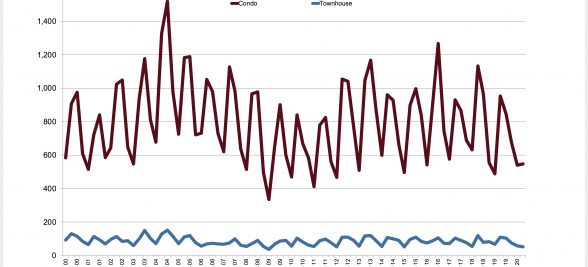
Downtown Boston Number of Sales by Property Type [Condo v. Townhouse]
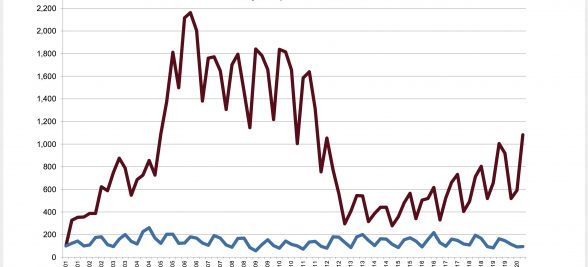
Downtown Boston Condo Listing Inventory v. Number of Sales [Index 1Q01 = 100]
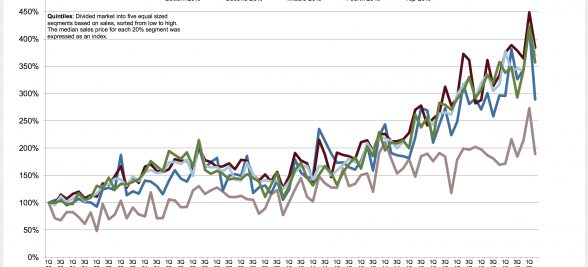
Downtown Boston Townhouse Median Price Index by Quintile
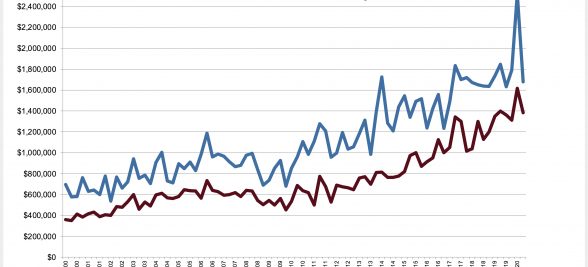
Downtown Boston Townhouse Sales Price [Average v. Median]
Downtown Boston Condo Sales Price [Average v. Median]
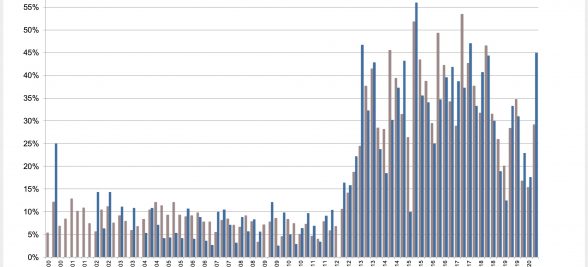
Downtown Boston Condo/Townhouse Market Share of Sales Over List Price
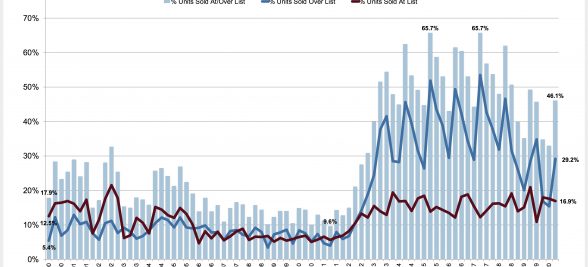
Downtown Boston Condo Sales Sold At/Over List Price
View all recently published Charts
You are receiving this email because you have requested these updates.
Click here to update your subscription preferences
( i.e. - stop receiving Charts, but keep receiving Housing Notes)
Or click here to
unsubscribe <<Email Address>> completely
from Miller Samuel's email list
Copyright © 2020 Miller Samuel Inc., All rights reserved.