June 2019
Russell Robertson, CFP®
ATI Wealth Partners has a blog! We've updated the website to be a little more SEO-friendly, and part of that included starting a blog. And by "blog", we mean a place for all of our past publications to live in plain-text format. We'll still be sending out our monthly On the Horizon newsletters via email as well, but if you want to read it on the webpage instead, go right ahead! You can even leave comments and let the search engine crawlers know we're legit. Thanks for the support, now let's dive right in to this month's newsletter:
It snowed two feet in Colorado on the first day of summer. That’s weird. Blame it on global warming. No seriously - CNN says the reason you had a snowstorm is because the atmosphere is “warmer and moister than before”, and then goes on to mention the 100-degree heat wave hitting Florida. First, slow down CNN. Second, a global warming could theoretically lead to colder temperatures. The sun’s rays hit the Earth directly between the Tropics of Capricorn and Cancer. That’s why they’re hot. The sun’s rays hit the poles very obliquely and get mostly reflected by the atmosphere. That’s why they’re cold. Circulation of that heat differential is largely due to ocean and atmospheric circulation patterns. Global warming could slow down those circulation patterns, which would reduce the ability of the planet to transfer heat to the extent it does currently, and would likely make the equator hotter than it is and northern/southern latitudes colder. Like in the Younger Dryas period or more recently the “Little Ice Age” in Renaissance Europe.
Anyway, Earth science tangent aside, the point is unintended consequences (especially when dealing with any sufficiently large, complex, and not fully understood system - like cough cough the economy cough), and how those unintended consequences just tend to make things weird.
A couple weeks ago, the market had a fit. It looked like the China trade deal was completely falling apart and another round of tariffs was coming, and then out of the blue there was a tweet about imposing tariffs on Mexico. The next week, the market was up. Why was the market up? Because of an expectation that bad things happening to the economy would make the Fed more likely to start cutting rates again and possibly even prompt another round of quantitative easing. Recall how the December market drop caused the Fed to completely abandon both their rate hike program and their balance sheet reduction program. In fact, futures markets have gone from pricing in zero moves on rates this year to a full four rate cuts in the next 12 months. (Fun fact: a 1% cut in interest rates over 12 months has always been associated with a recession.)
Most all of the economic data coming in recently has been pointing to a slowdown. We’re not in contraction yet, but pretty much everything is slowing down. And yet stocks are up. That’s weird. Actually, everything’s up. The S&P 500 hit a new all-time high as the yield on the 10-year Treasury dipped below 2% (again - and yes, the yield curve is still inverted) and gold broke out to a multi-year high over $1,400/oz. Gold going higher and treasury yields going lower does not signal that all is well with the economy. And for it to happen while stocks continue to go up on…nothing, well, that’s weird, too.

Are you sure it was trade deal hopes Peter? Are you sure it wasn’t...nothing?
As of Monday July 1st, this will officially be the longest economic expansion in US history. And yet we’re about to dip back into “extraordinary” monetary policy that has only ever been used in the depths of the Great Financial Crisis. That’s weird.
Another all-time high from earlier this month: the amount of negative-yielding sovereign debt. It just passed $13 trillion with a “t”. You know what doesn’t happen in a rationally functioning economic system? Negative-yielding debt. Here’s a table snapshot that focuses on Europe. Anything highlighted in red has a negative yield.
Before you look though, do a quick thought experiment. How much would you charge in interest to loan someone money for 5 years? What about 10 years? What about 30 years? What if that “person” was the government of Switzerland? What would you charge the government of Switzerland if they needed a loan for 30 years?
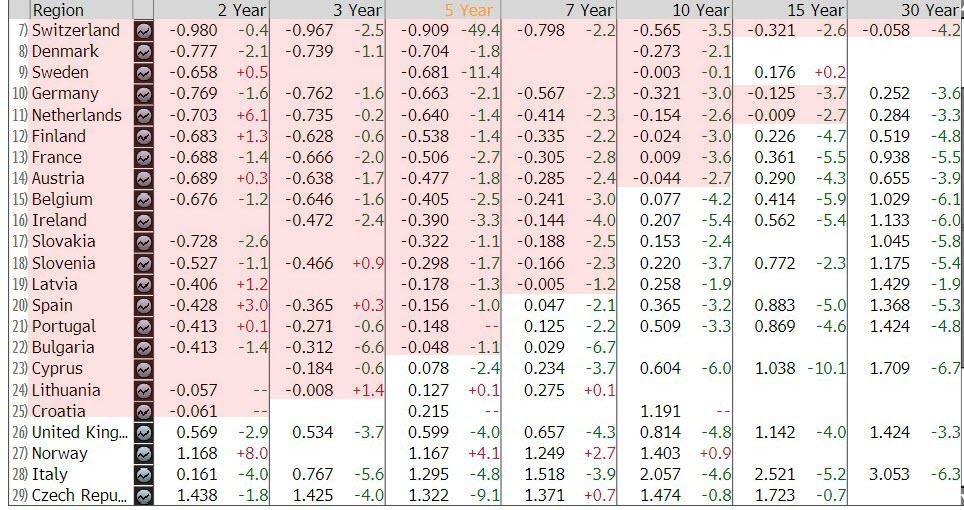
Unless you answered with “not only would I not charge the Swiss government anything, I would pay them every year for 30 years for the privilege of loaning them money,” then you are wrong. Or perhaps it is not you but rather something about the world that is wrong.

There is no spoon.
But there’s more than one problem with a market that’s up 18% as everything else is up as well. Let’s assume for the moment that the stock market is correct and the bond market is wrong - what we mean by this is that stocks are correctly pricing in strong economic growth and bonds are incorrectly pricing in a coming recession, resulting in a large drop in bond prices to resolve this weird Schrodinger’s Cat of a market. (Fun fact: this is almost never the case - history has shown that the bond market is much more reliable than the stock market, so in cases of divergence like this it’s usually stocks that end up “catching down” to where bonds are.) But we’ll assume that stocks are correct and economic growth is solid and will continue.
Here’s the problem. Long-run economic growth has a cap on it. When looking at the economy as a whole, economic growth comes from two places and only two places: population (labor force) growth and productivity growth. Labor force growth has been averaging around 0.5% for the last decade. So has productivity growth. That means that structurally, long-run economic growth is capped closer to 1% at the moment.
Let’s be generous and assume healthy increases in both labor force and productivity going forward as the labor force become increasingly made of up robots that can work around the clock. We’ll also be generous and assume that all real people are still working as well and not just sitting at home getting their government-provided “living wage”. Let’s assume both of those together get us back to the post-WWII boom period where labor force growth was closer to 2% and productivity growth was closer to 2.5%. That means that long-run economic growth could get back up to over 4%.
The stock market as a whole is bound by the long-run economic growth of the economy. There’s a lot of cyclical noise in stock markets that overrides that signal, but long-tem durable gains are limited by the cap on underlying economic growth (and inflation). Here’s a chart from John Hussman illustrating the point using market data all the way back to the Great Depression:

It’s a really busy chart, but pay attention to the dark red horizontal lines. These represent the durable market gains. Note how not uncommon it is throughout history to periodically revisit market levels last seen several years earlier. He’s using the green line as a measure of “normal” valuation to make a point that much of the market gain since 2009 is likely transitory and not durable; we’re not going to go that far.
We will say, however, that sustained market gains above and beyond long-run caps effectively “pull forward” future returns. So 18% market returns in a year is not wrong, per se. But it does mean that all else equal, you are currently pricing in an assumed growth rate for several years into the future such that if the rate actually materializes as assumed, there should be zero market growth to get back to the same valuation levels you had at the start of the 18% year.
Of course, this itself assumes that people actually trade stocks based on assumptions of growth rates and fundamentals. Which would normally be the case except for another of those unintended consequences of the Fed’s monetary policy: namely, stock buybacks. The single largest source of demand in the stock market in the last decade has been corporate buybacks. According to Goldman Sachs research, net corporate buybacks in the US market since 2010 have averaged $420 billion per year (and crossed $1 trillion with a “t” in 2018). Over that same time period, average net demand from households, mutual funds, pension funds, and foreign investors combined was less than $40 billion per year.
Corporate stock buybacks are bad enough in and of themselves as a tool for market manipulation and insider trading, but corporations have been literally taking on new debt just to buy back their own stock. All thanks to the Fed’s zero-interest rate policies of the last decade. If you actually want to do something realistic about economic growth and wealth inequality, start with banning corporate buybacks. And then reverse that terrible Citizens United decision.
Alright, soapbox over. We’ll save the political economic analysis for next year when there’s actual policy proposals to discuss and it’s (hopefully) less of a circus. The point of this newsletter was that markets ended the second quarter above their 200-day moving average. For our investment management clients, that means we should be fully invested in equities. But we’re not. There’s just too much weirdness going on at the moment for us to feel comfortable taking on that kind of risk, especially when it all seems to be predicated on an assumption of aggressive Fed easing coming soon - easing that, by all indications, would be due to the onset of a recession.
We’ll leave you with a couple market snapshots to digest. Each one of these covers a 2-year period. Here’s the S&P 500 making new all-time highs:

Here’s the broader US market over the same time period (the NYSE Composite Index) not making new highs (not only not making new highs but still down ~9% or so from January 2018 levels):

Here’s global stock markets (represented by MSCI ACWI) over the same time period most definitely also not making new highs:

And here’s all three of them on one chart. S&P 500 in blue, NYSE Composite in purple, ACWI in orange:

Is that the S&P 500 up 9% more than the broader US market? Yes, yes it is. Weird.
____________________________
If you’re reading this, it means you either signed up on the website (thank you!), we signed you up, or one of your awesome friends forwarded this over to you and you should go ahead and sign up yourself for a monthly dose of entertainment and thought-provokingness from the world of personal finance. If you're still reading this, we appreciate the support but it's the end of the letter...you can stop now.
