Happy Friday! Apparently there are different types of Girl Scout cookies available in other places. My wife got some French Toast cookies from California that are amazing. I just had a couple with my morning coffee and I think I might be in heaven. I hope you give yourself a treat today too.
Thanks for reading!
What I’m Listening to: Today I’m tuned into a new release from one of my recent favorites, Oilix.
Last week Microsoft announced Viva, a single employee experience platform “designed to empower people and teams to be their best.” This announcement reshapes the employee experience and people analytics tech market. RedThread Research has a nice look at how this reshapes the employee experience and people analytics tech market. If you’re interested in even more, Josh Bersin has also written about the massive market impact of Viva..
16 Reasons Why People Don’t Share Their Knowledge — And What to Do About It
To change an organization’s culture from one of knowledge hoarding to one of knowledge sharing, it’s important to understand why people may not be sharing their knowledge with one another. In the article, Stan Garfield identifies 16 common reasons why people don’t share what they know along with recommended solutions for each one.
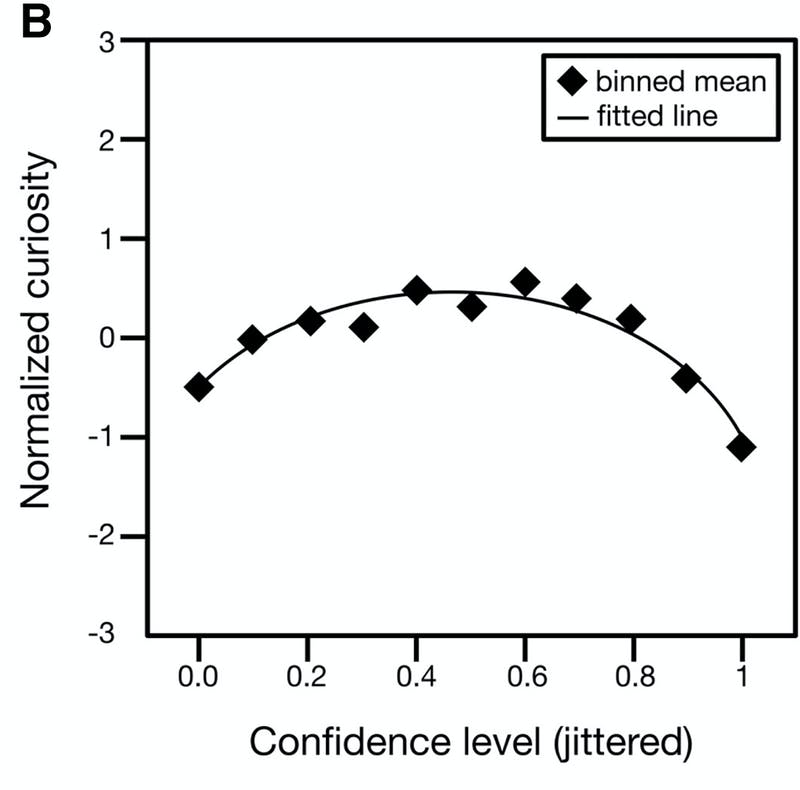
Curiosity is a curve. Where does your message fit?
This is a great article by Tamsen Webster about what you should do to get attention. Based on some research she cites, the key is to “find the magic middle of the curiosity curve”. You should try to make sure your message is anchored in something your audience already wants… but doesn’t yet have… This aligns with a “Steal from Marketing” point of view that I’ve talked about a lot. (For example: “How can you make your ideas irresistible?”)
Presenting data is an important skill. In this post, Jon Schwabish shares five graphs that perhaps you’ve never used before but that you should consider. They either do a better job showing certain types of data or they are more engaging and interesting than basic chart types. If you’re interested in more like this, check out his book “Better Data Visualizations”